Science Platform Tokens
The Notebook Aspect of the Rubin Observatory Science Platform provides access tokens for interacting with other services provided by the Science Platform. An example is the TAP service provided by the API Aspect. When interacting with authenticated services for within the Notebook Aspect you typically doesn’t need to interact with the access tokens since the various clients are able to pick up the token from your user environment. If you want to access services from a local machine (for example, to access the TAP service from TOPCAT), you will need to create an access token for that purpose.
This page will give you an introduction to the access token, where to create one for use from a local machine, and how to use it in an environment outside the Notebook Aspect.
The current user interface for managing tokens will look very primitive. The functionality is present, but the UI design is not yet complete. This will be improved in later development.
The Notebook Aspect access token
Whenever you log on to the Notebook Aspect, an access token will be generated for you and stored in your home space in the Notebook Aspect.
This token is time-limited and will be refreshed when you log out and log back in.
The token is stored in the file ~/.access_token so that it can be accessed by notebooks and used to authenticate to other Science Platform services.
The environment includes a notebook, at ~/notebooks/system-test/token-info.ipynb, that allows you to inspect that token.
Executing the two cells in the notebook will provide information about token creation time and lifetime among other things.
You will note from the above notebook that the token is also provided as the value of the environment variable ACCESS_TOKEN, but the file version should be considered primary.
Using a token outside the Science Platform
If you want to use an access token from your local system, you can create a new one. At creation time, you can
give the token a name,
restrict the token’s access to only the services you need, and
configure the expiration, including setting it to not expire.
Following is a recipe for an example workflow that creates a new token to access the Science Platform TAP service from a local computer using TOPCAT. You can apply similar steps to other use cases.
Go to Rubin Science Platform in a web browser.
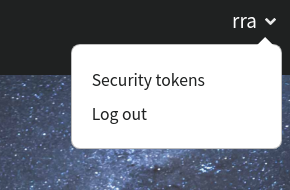
Select Security Tokens from the user drop-down menu at the upper right.
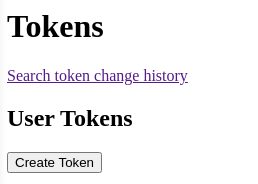
Click on Create Token under User Tokens.
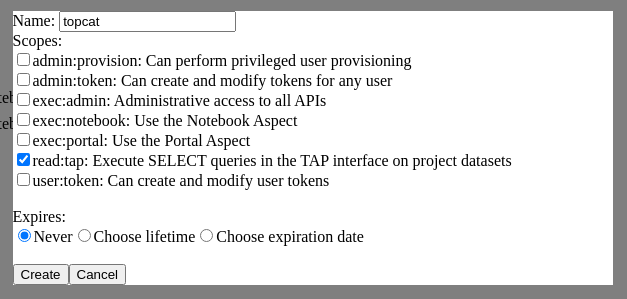
Choose a token name, scopes, and expiration. Usually you will want to name the token after the application you will use it with.
Which scopes to select depends on what you’re doing.
To query the TAP service, the scope you want is
read:tap.If you know that you’ll only be using the token for a limited period of time, you can choose an expiration date. Otherwise, you can set the token to never expire.
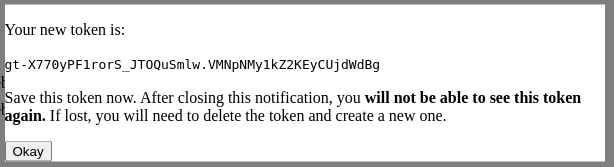
Click on Create. You will be shown the token, but only once. Be sure to copy this token and save it somewhere secure on your local system.
On your local machine open up TOPCAT. This will require having Java installed.
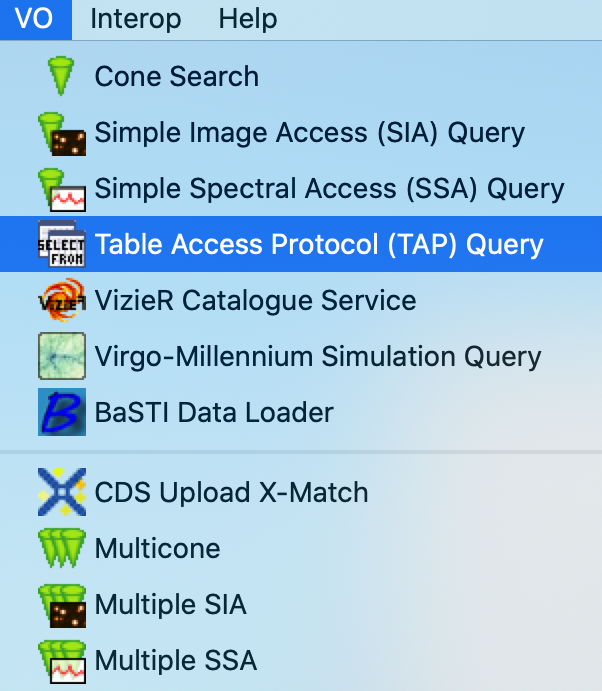
Once you have
TOPCATopen, you will see a menu item called “VO”. From that dropdown, select the entry that says “Table Access Protocol (TAP) Query”.
This will bring up a window with a list of available TAP services. We want to use a service with a known endpoint. Enter
https://data.lsst.cloud/api/tapin the box at the bottom of the page labeled “TAP URL”.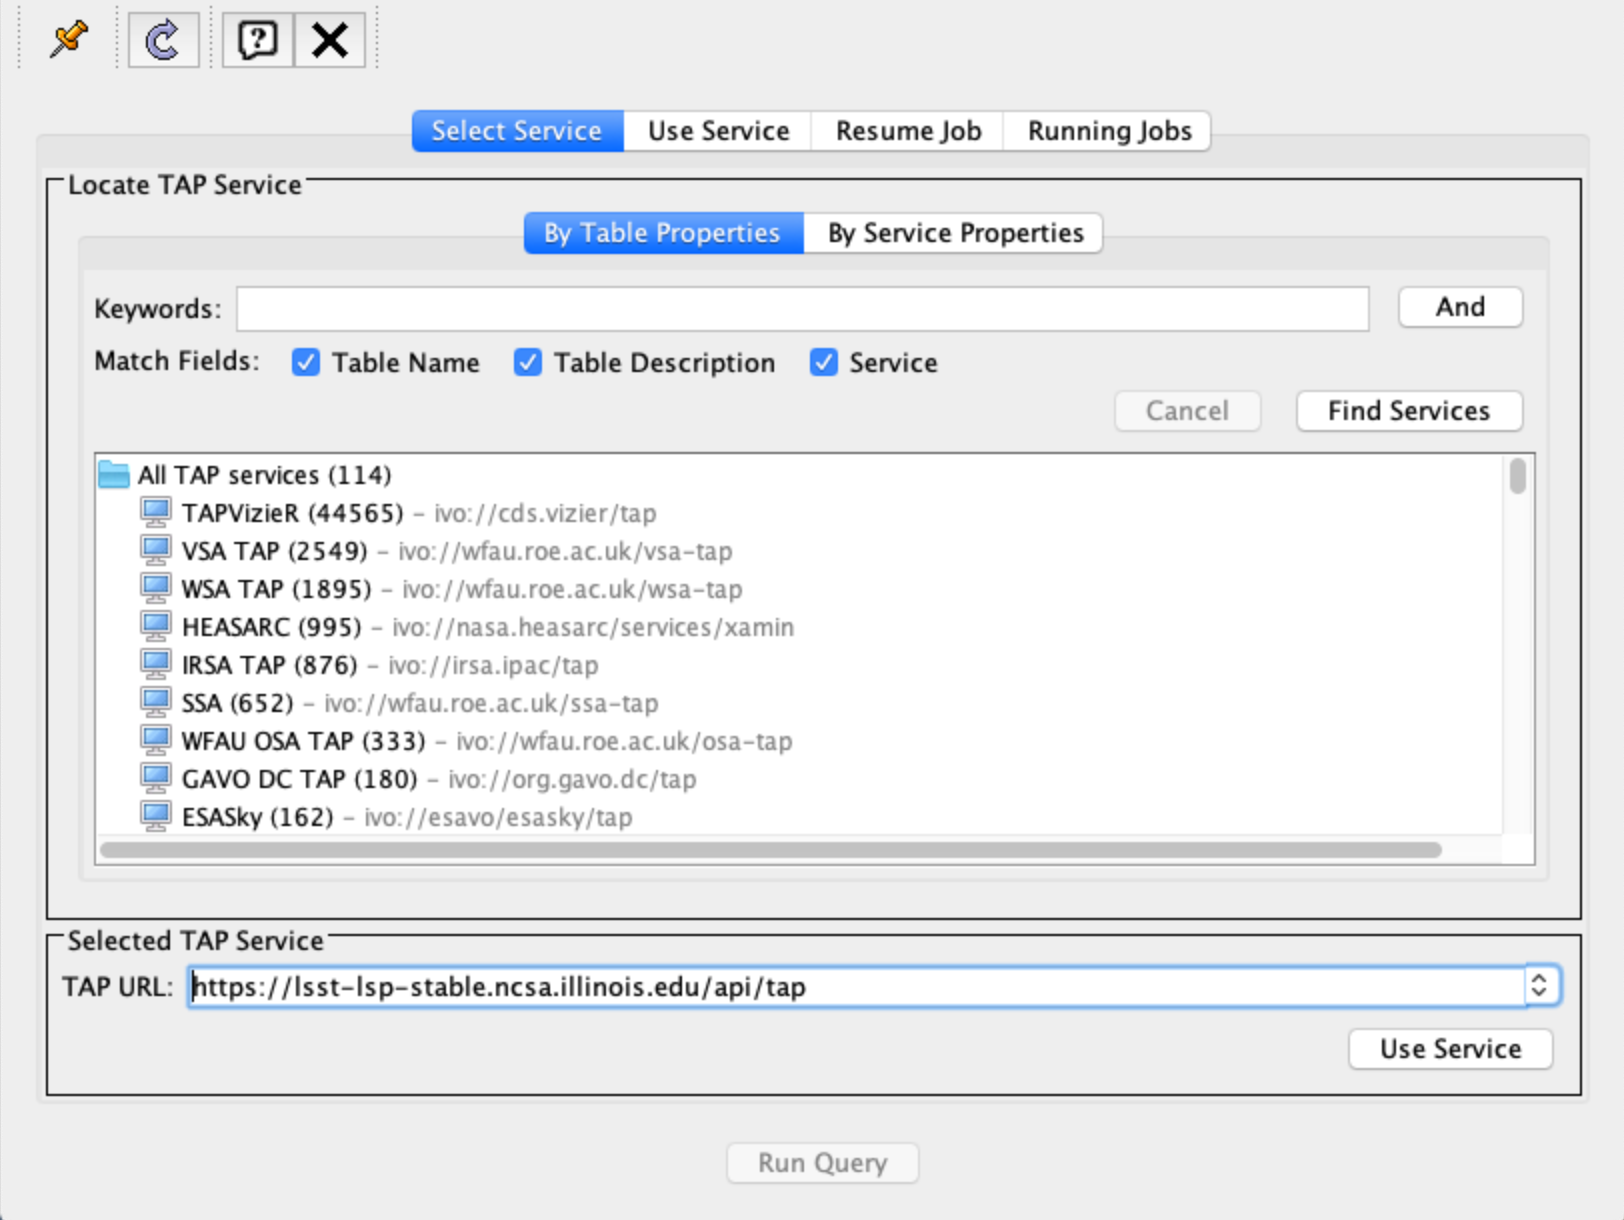
Clicking “Use Service” will bring up a username/password dialog. Set the User to
x-oauth-basic. Paste the entire access token into the Password field.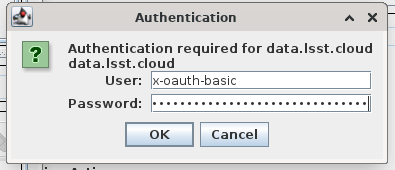
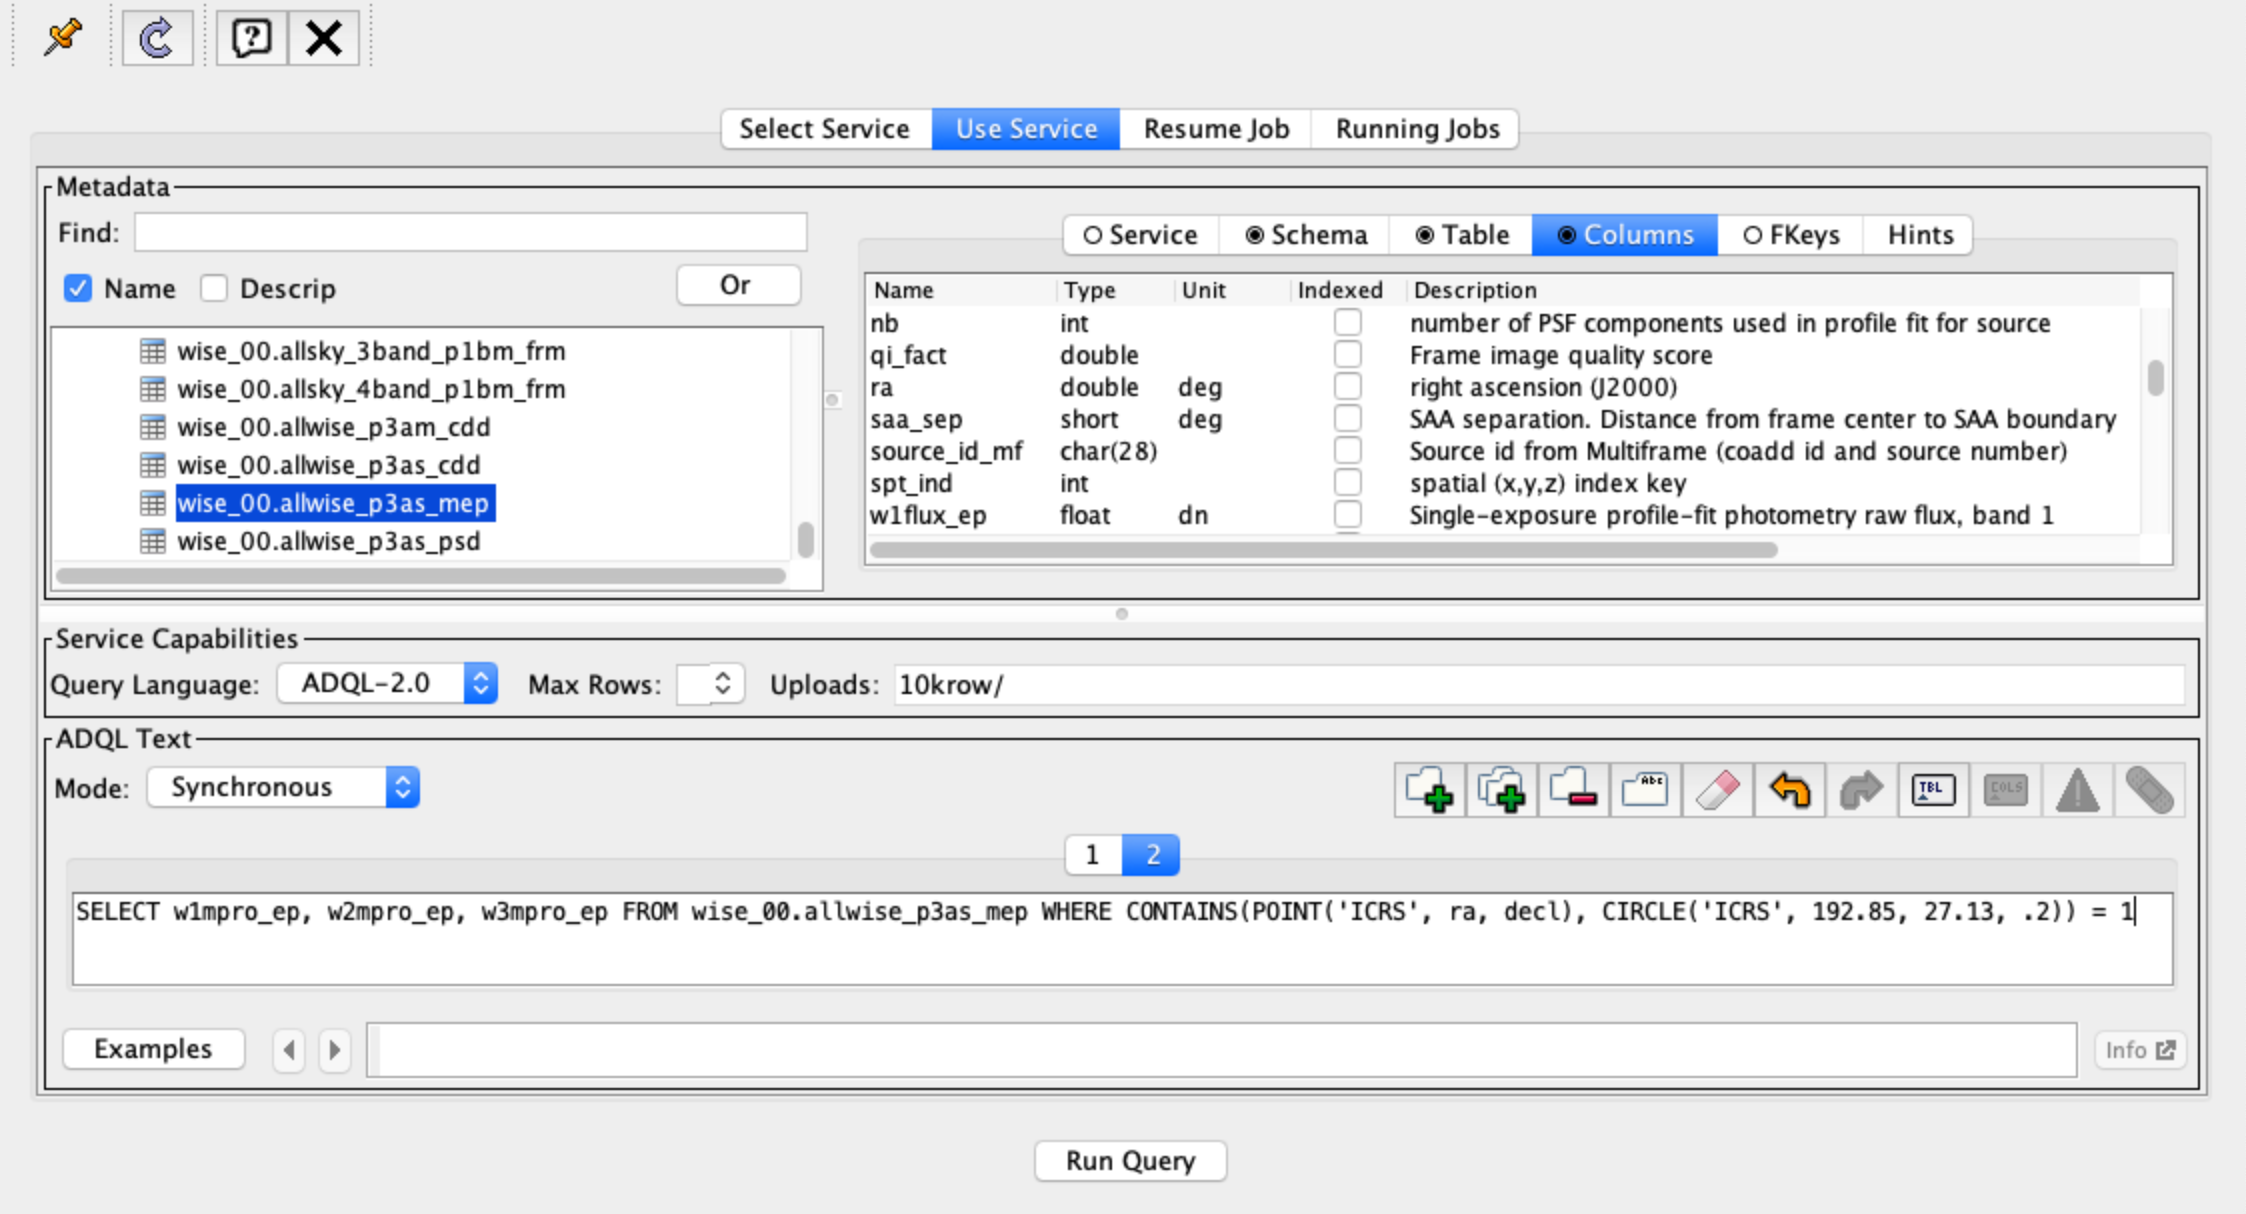
If authentication is successful, the window will change to the TAP service window and information about the various tables in the service will appear in the left portion of the upper panes. If you select a table, you will see information about the columns in the table to the right of the table listing.
For this example, I used the
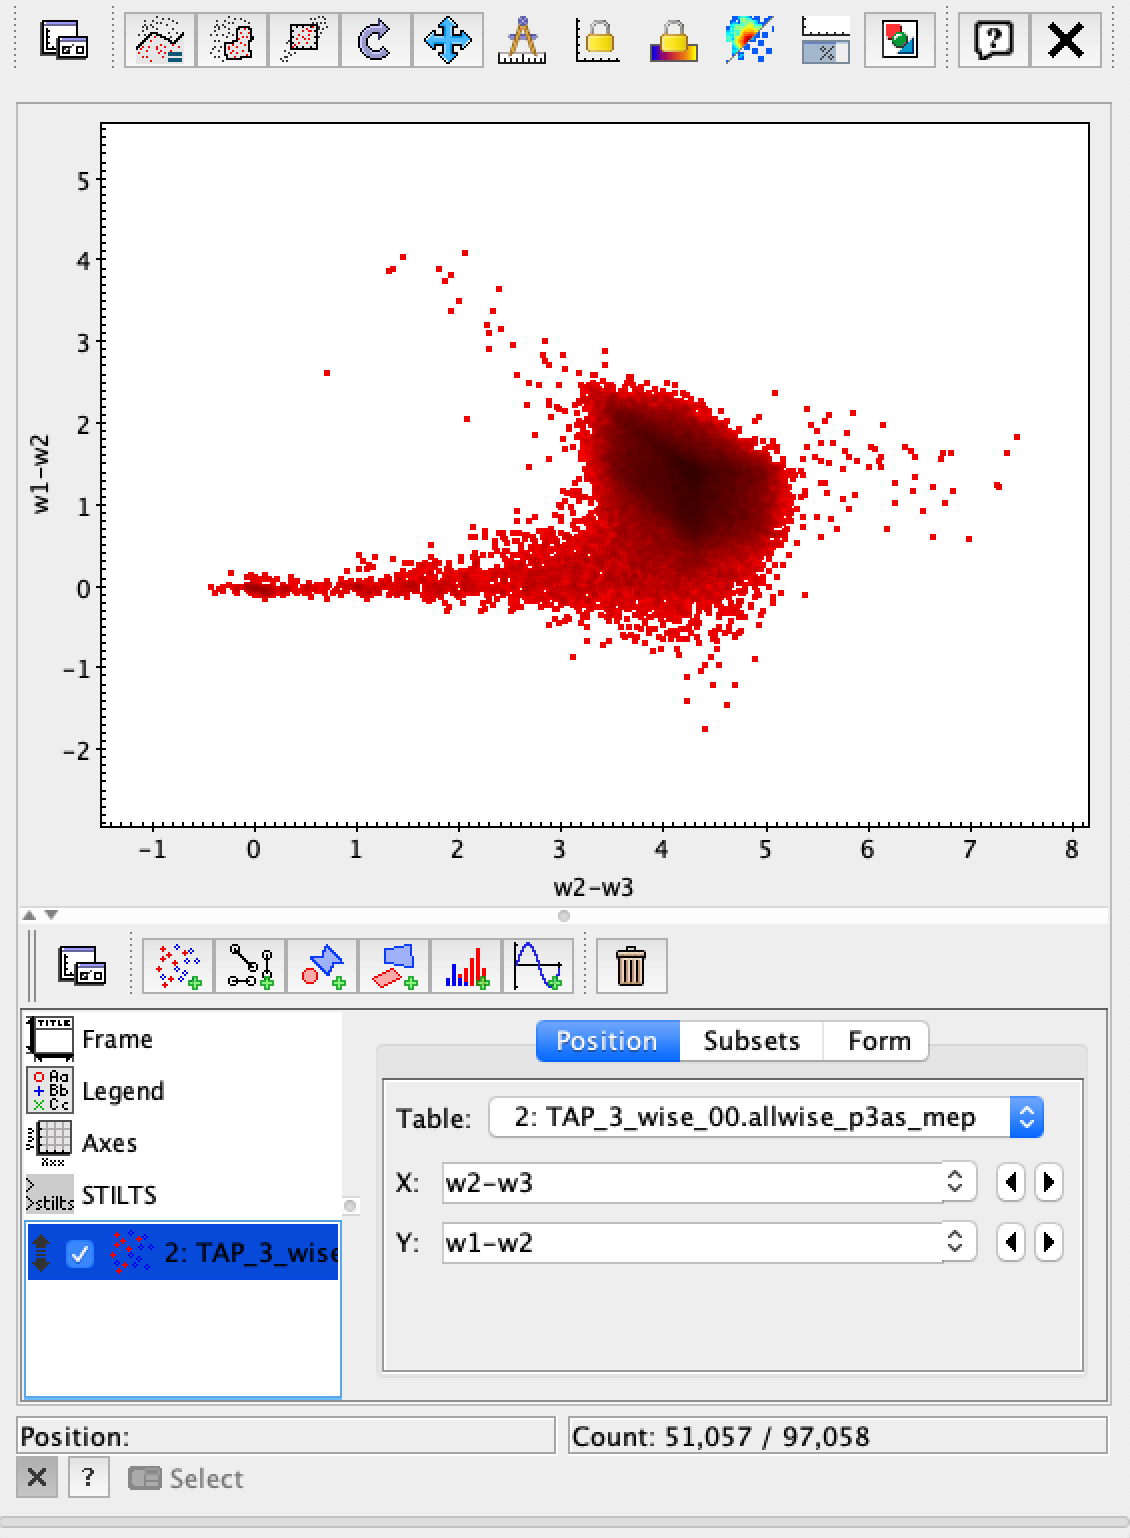
wise_00.allwise_p3as_meptable which provides photometry among other things. Make a query by entering the ADQL in the box at the bottom and click the “Run Query” button.The example query selects three magnitudes from a circular region on the sky.
SELECT w1mpro_ep, w2mpro_ep, w3mpro_ep FROM wise_00.allwise_p3as_mep WHERE CONTAINS(POINT('ICRS', ra, decl), CIRCLE('ICRS', 192.85, 27.13, .2)) = 1
Once the query returns, you can make plots like this color-color diagram. I made two more synthetic columns from the magnitude columns to plot.