Demo notebooks
The Notebook Aspect is preloaded with demo notebooks to help you learn about notebook-based computing and inspire your own work on the platform.
Using the demo notebooks
You can find these notebooks in the notebooks/notebook-demo directory of the JupyterLab file browser.
Double click the directory, then double click on the notebook to open it.
You can click Run → Run all Cells to run the entire notebook, or type shift-return to run one cell at a time.
In the terminal, you can find notebook-demo in the ~/notebooks directory.
Note
The notebooks/notebook-demo directory is hosted at https://github.com/lsst-sqre/notebook-demo.
Every time you log into the Notebook Aspect, the default branch (called prod) is updated from GitHub.
Avoid running git commit on the prod branch.
Notebooks
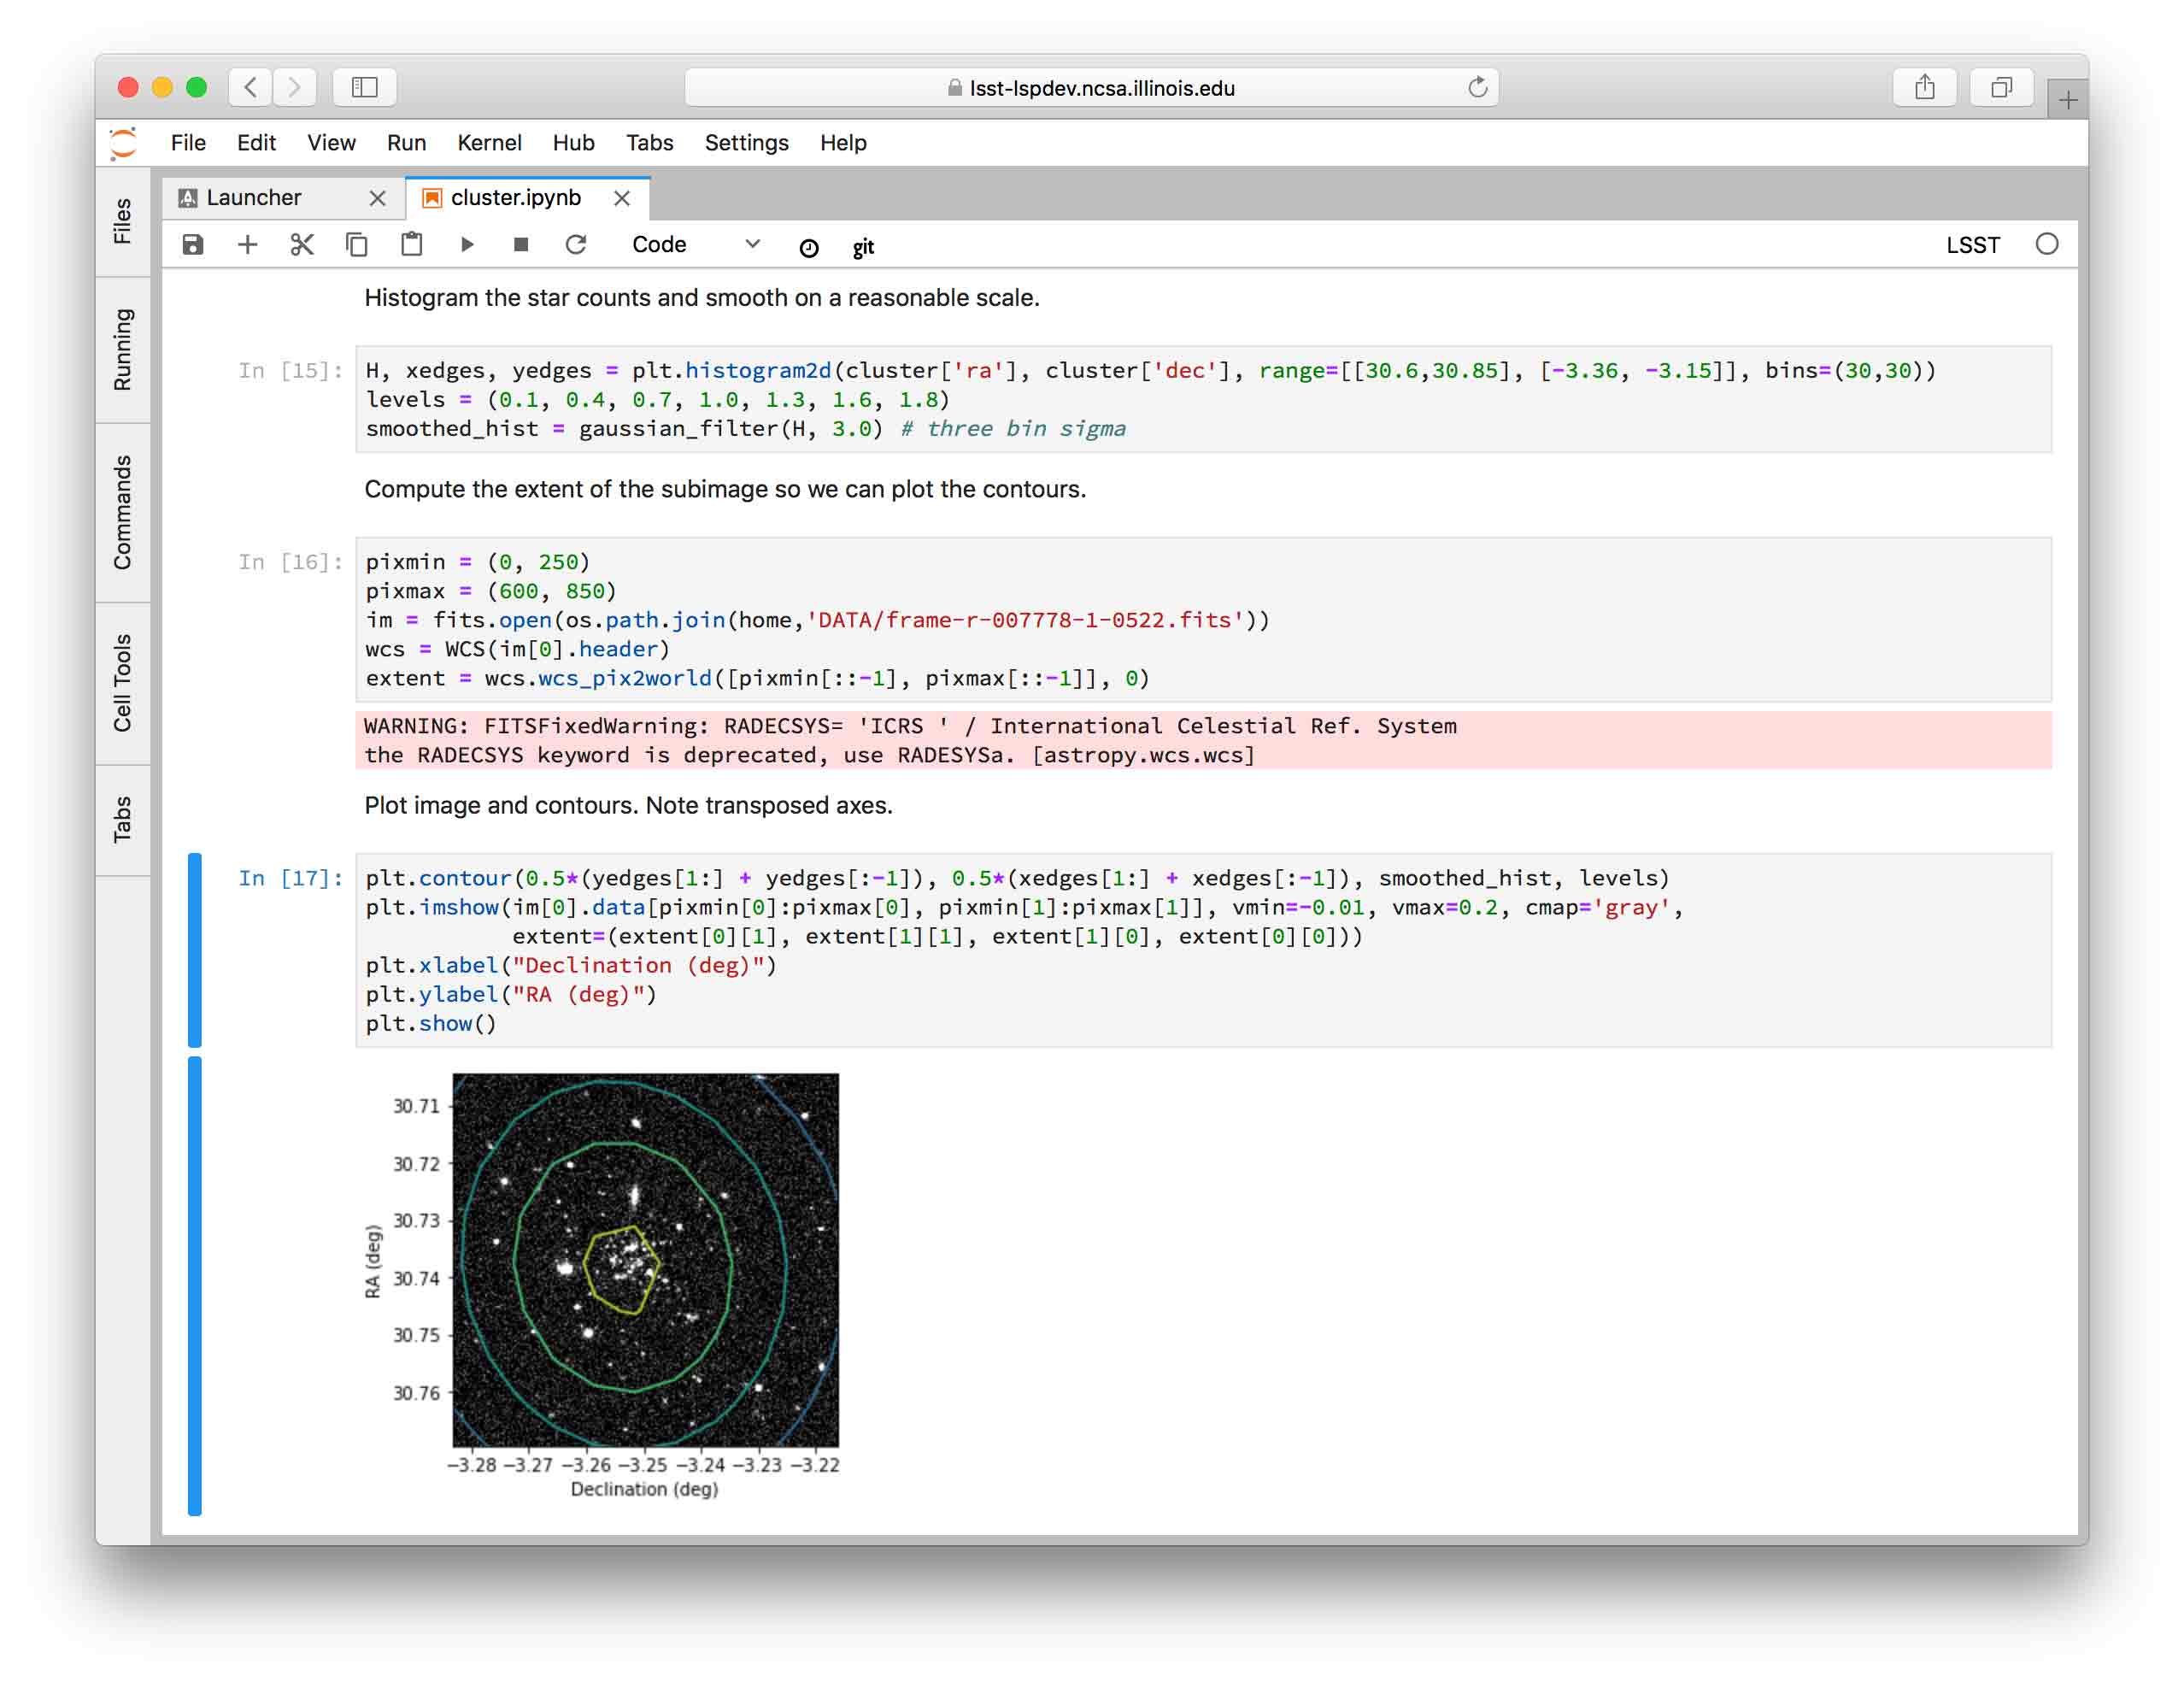
cluster.ipynb (Whiting I)
This notebook explores a very simple analysis to show the utility of notebooks in general, and some of the features of the JupyterLab environment specifically.
This notebook uses data from DR14 of the SDSS survey, using the globular cluster Whiting I as a starting point.

Firefly.ipynb (Firefly Visualization Demo)
This notebook is intended to demonstrate the Firefly interactive interface for viewing image data. It also builds on the pedagogical explanations provided in the Getting started tutorial of the LSST Science Pipelines documentation.
This tutorial seeks to teach you about how to use the LSST Science Pipelines to inspect outputs from processCcd.py by displaying images and source catalogs in the Firefly image viewer.
In doing so, you’ll be introduced to some of the LSST Science Pipelines’ Python APIs, including:
- Accessing datasets with the
Butler. - Displaying images with
lsst.afw.display. - Pass source catalog data directly to the
FireflyClient.
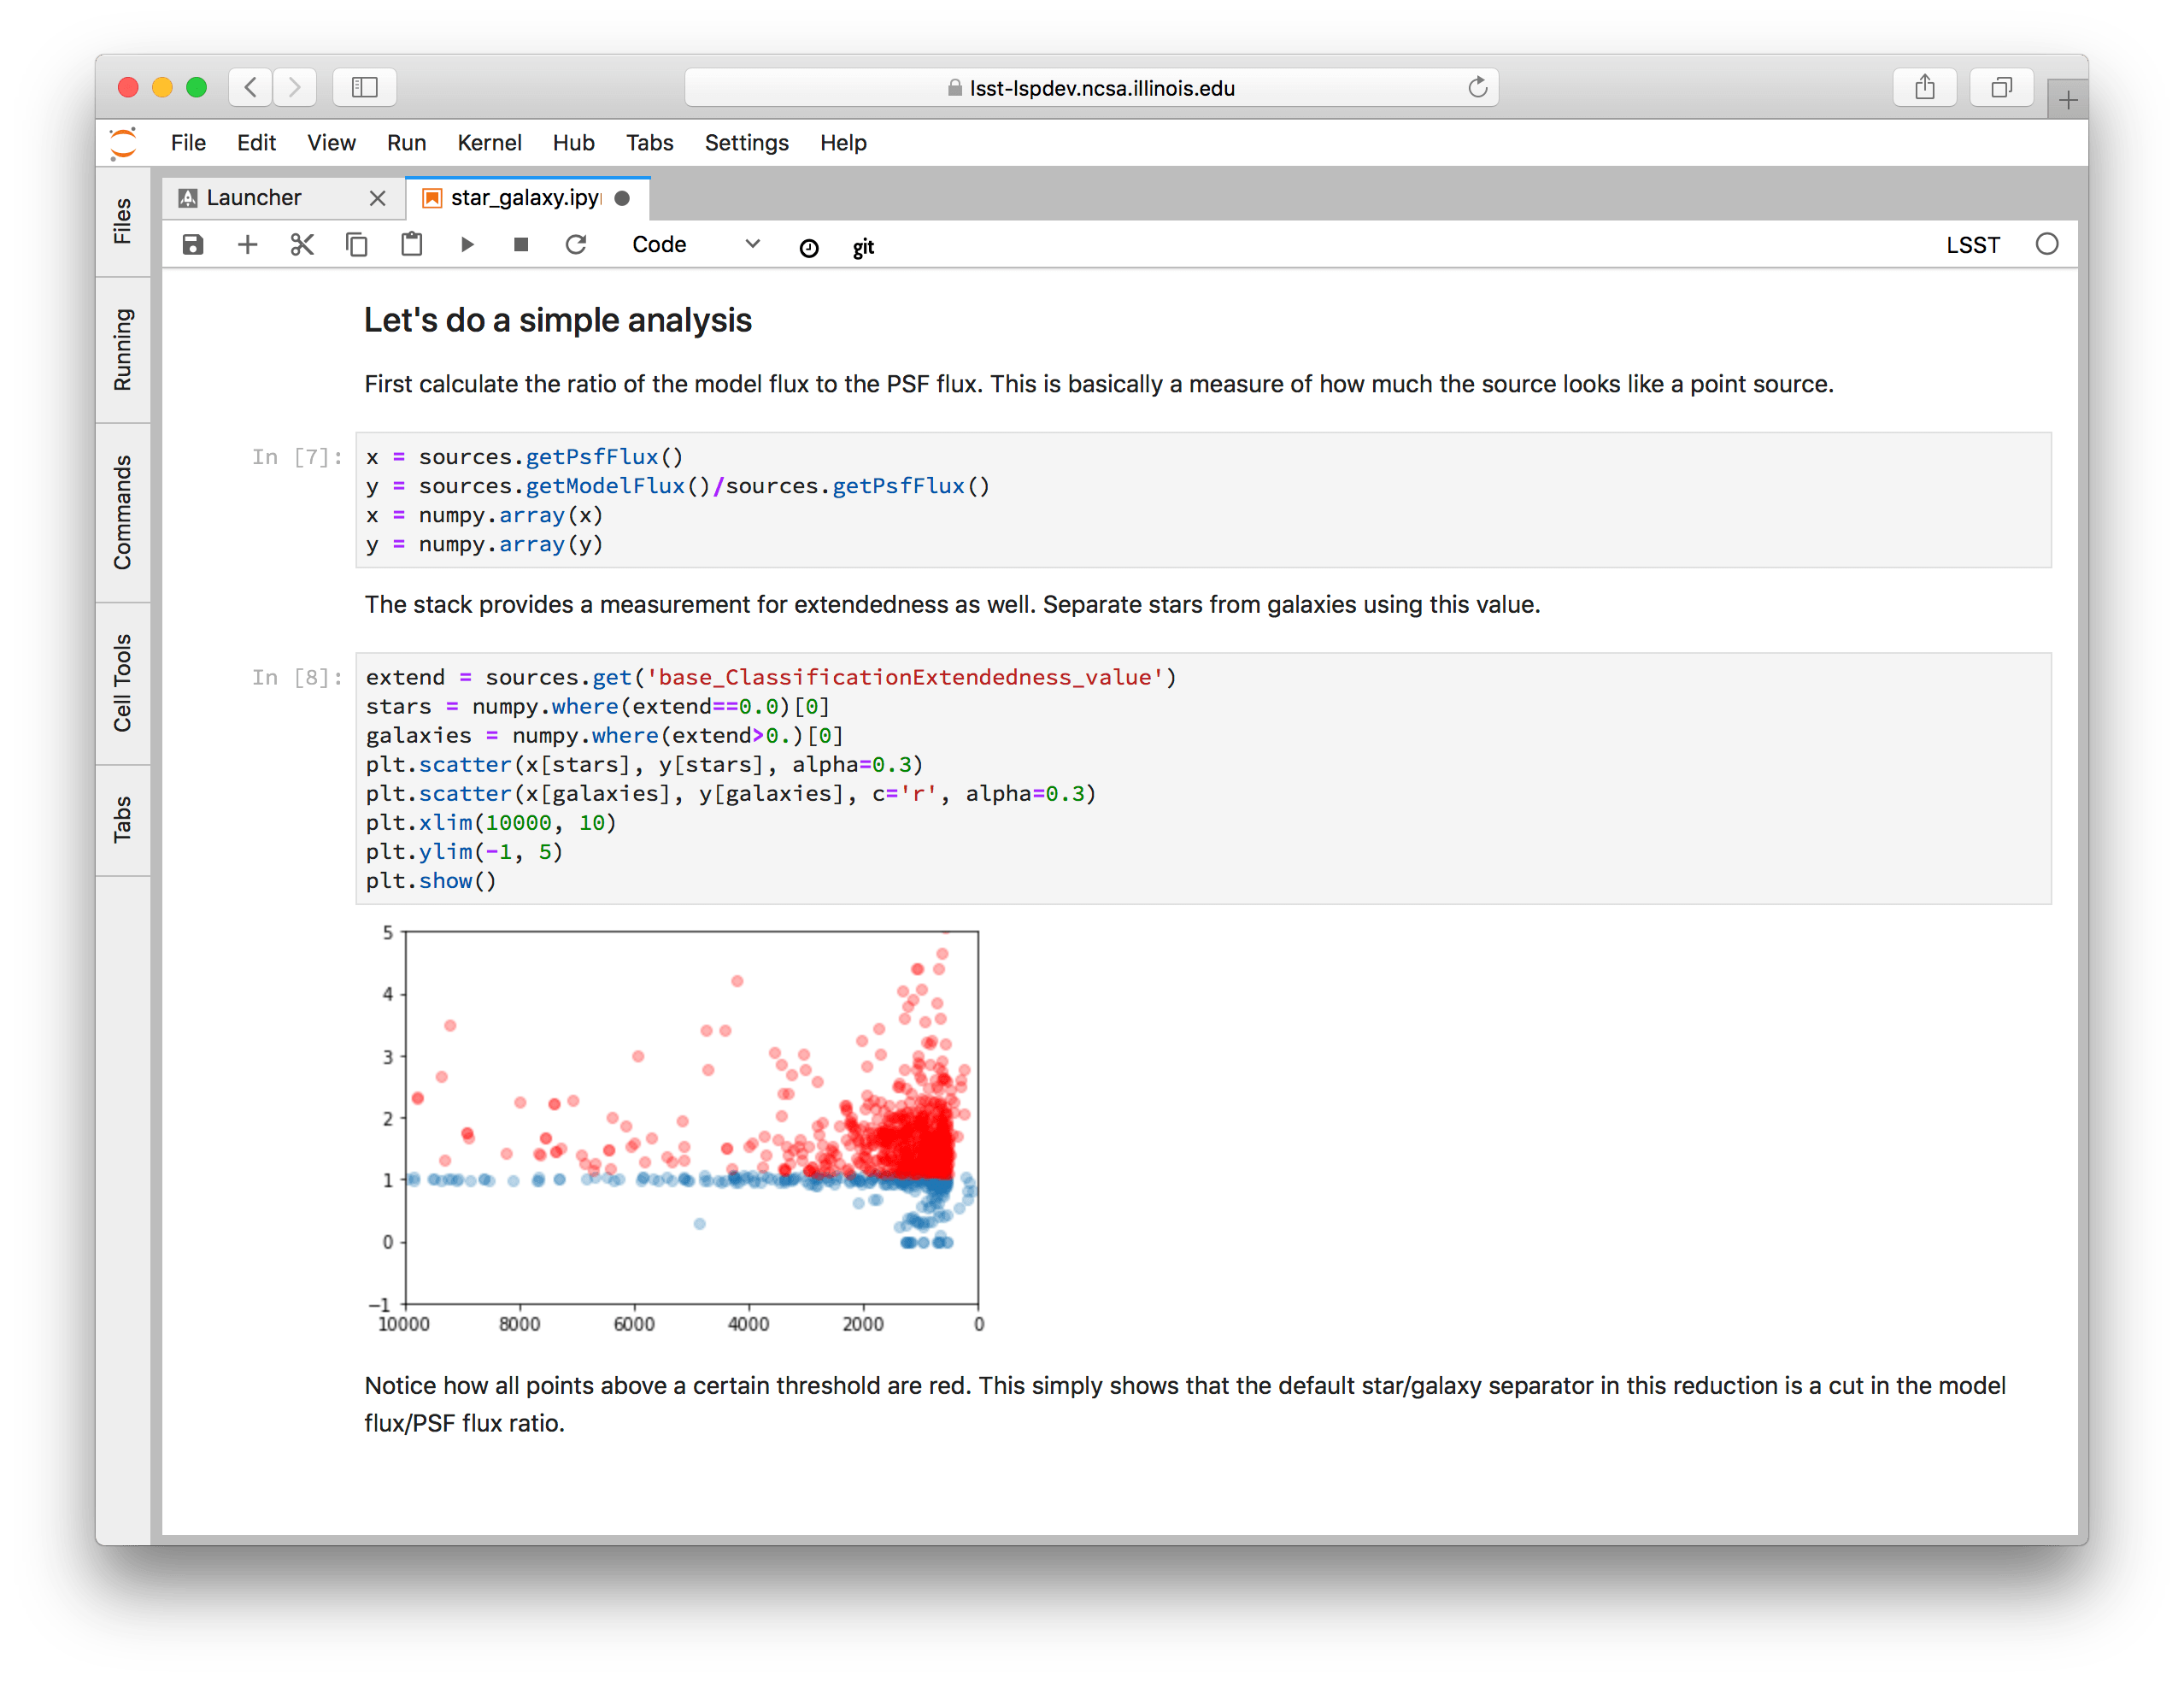
star_galaxy.ipynb (A very simple example of star/galaxy separation)
This notebook uses the LSST Science Pipelines’s Butler to get an Exposure and source table, and then use the base_ClassificationExtendedness_value to classify sources as stars or galaxies.
The notebook shows how to use Matplotlib to visualize the sources on the exposure, and analyze the performance of the star-galaxy classifier.

More notebooks
See LSST-related notebook repositories to discover more notebooks being shared by LSST and the community.